Overview
The Overview tab displays key metrics about your organisation’s platform usage and workforce data.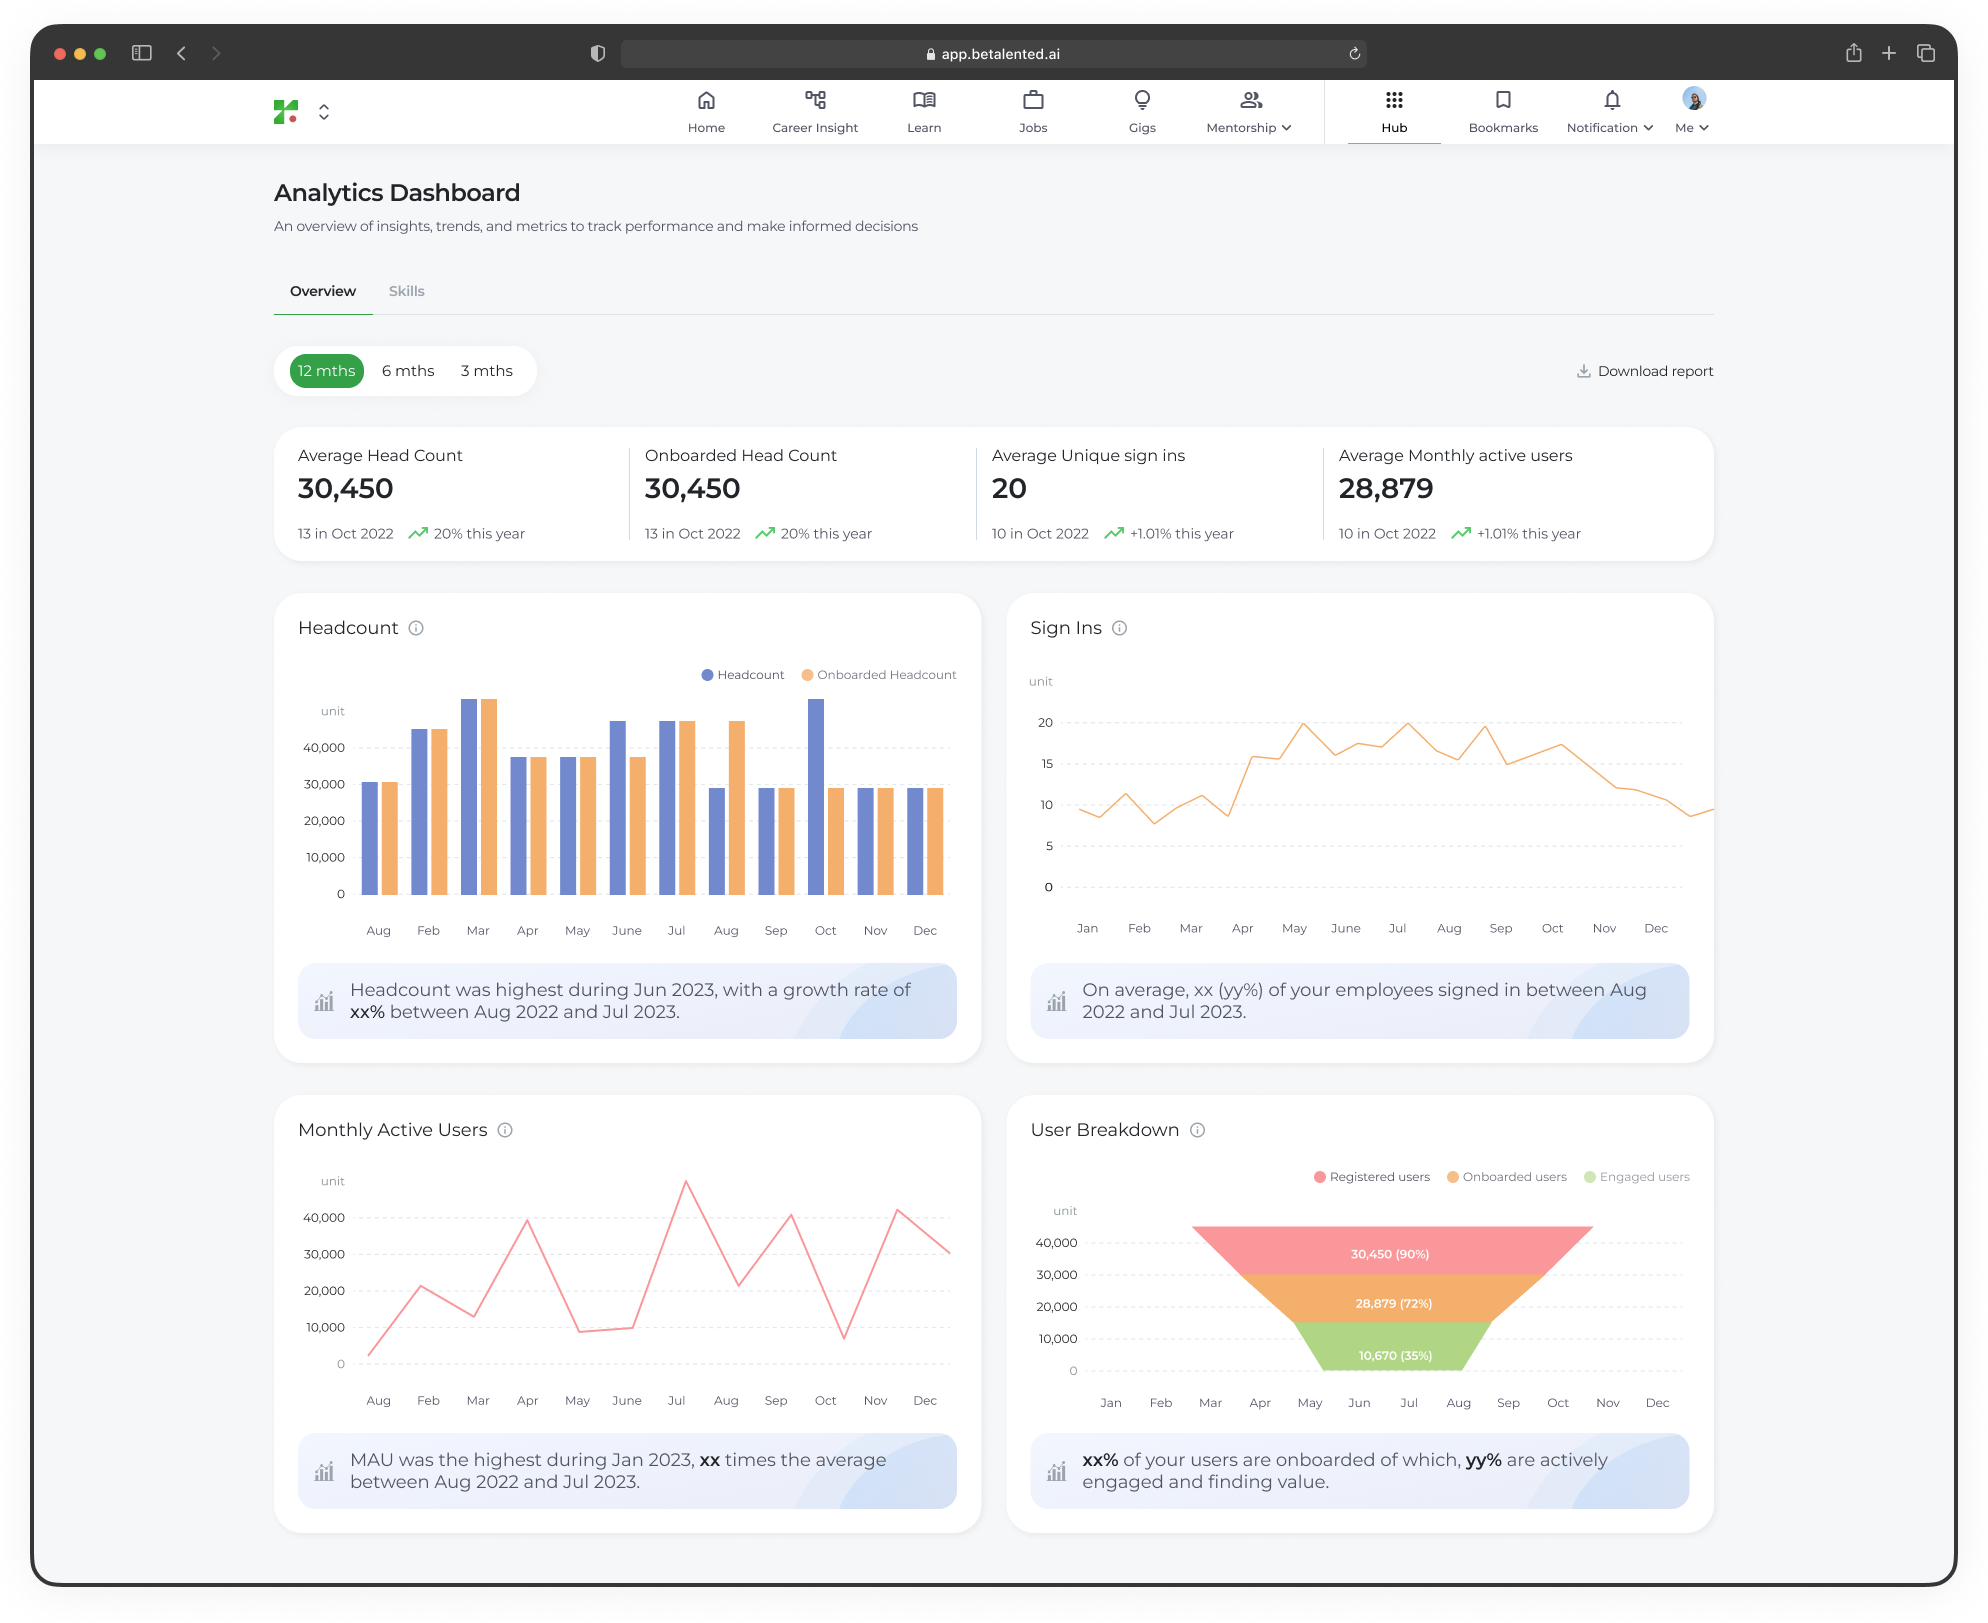
Key metrics
Skills
The Skills tab provides visibility into your organisation’s skill landscape and identifies areas that need attention.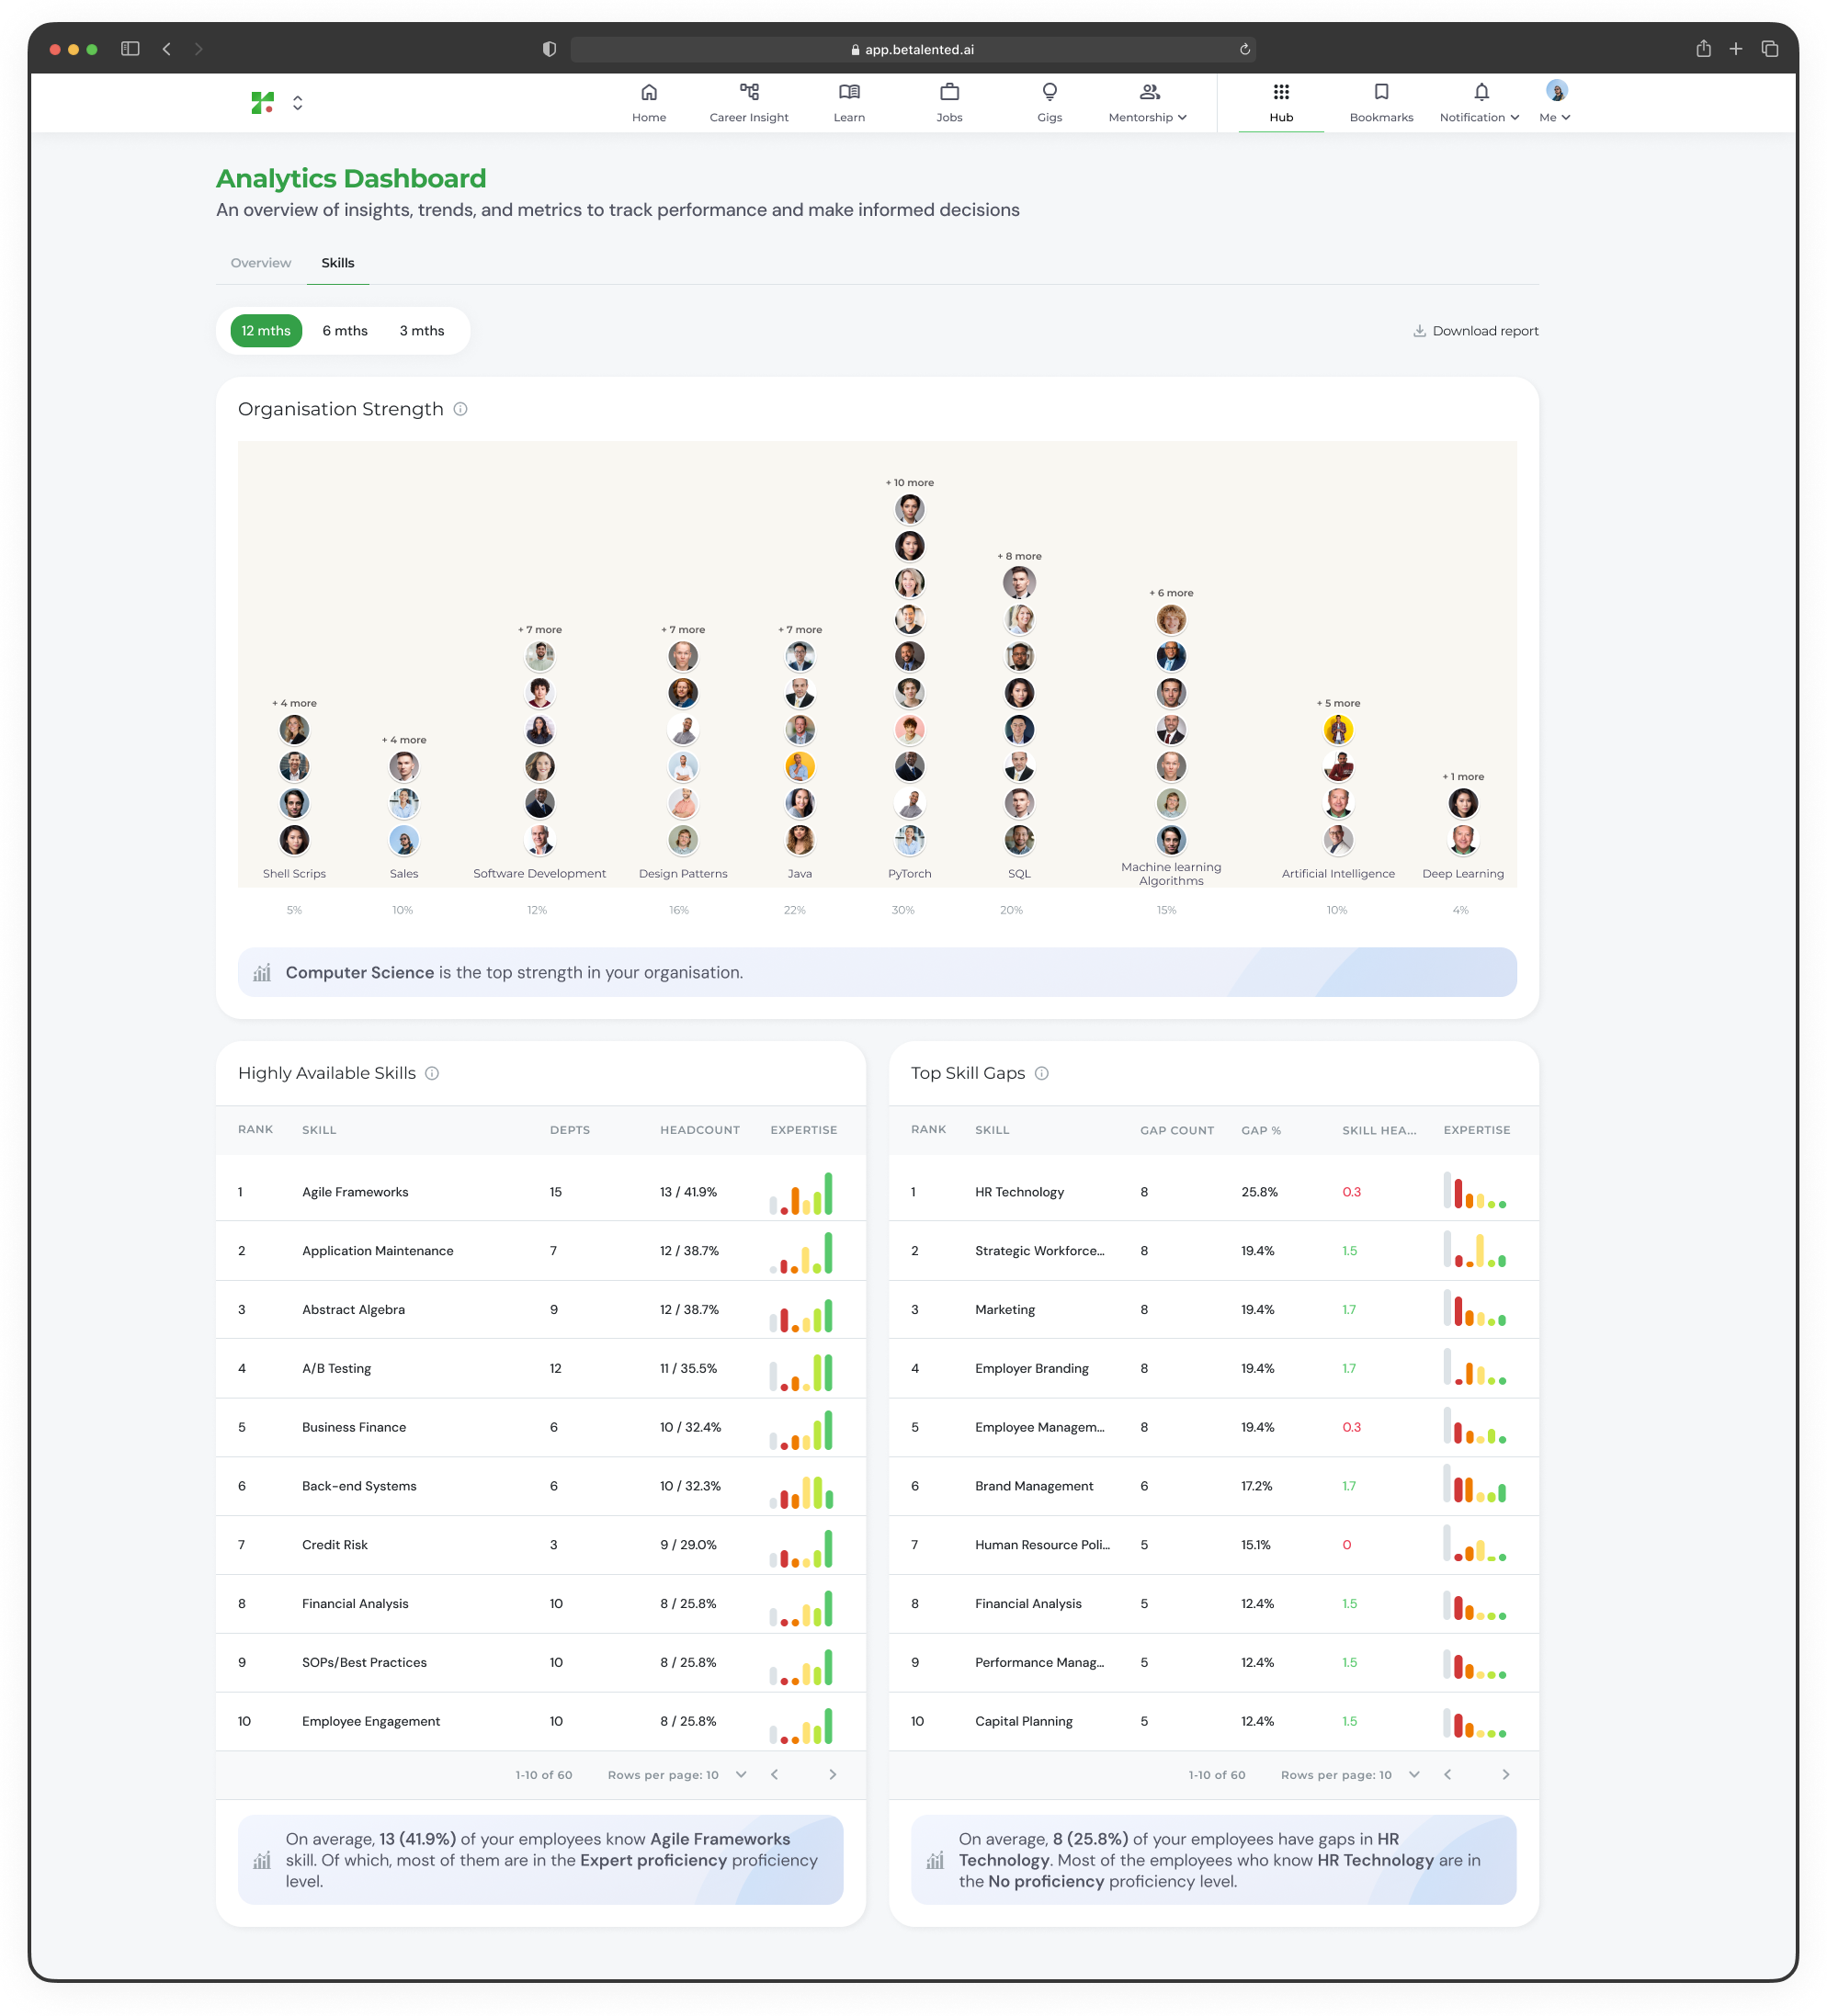
Organisation Strength
A visual display showing employees grouped most skills your company has.Highly Available Skills
A ranked table showing the skills with the highest availability across the workforce.Top Skill Gaps
A ranked table identifying the largest gaps between required skill levels and current employee expertise.Use the Top Skill Gaps data to prioritise learning investments and target areas where your workforce needs the most development.